Reading lab reports
How HPLC and mass spectrometry testing works
What HPLC and LC-MS measure, how to read a chromatogram and retention time, why identity and purity are separate results, and the limits every COA carries.
- Published
- Reading time
- 6 min read
On this page7 sections
Key takeaways
- HPLC separates a sample over time. Purity is the main peak’s share of the total peak area.
- Mass spectrometry measures molecular mass, the routine evidence that the main peak is the right molecule.
- Purity and identity are separate results: a clean peak of the wrong molecule can still read 99%.
- Neither test sees water, salts, endotoxin or other vials, and small differences between labs are rarely meaningful.
Almost every research peptide COA rests on two techniques: high-performance liquid chromatography (HPLC) and mass spectrometry (MS), often run together as LC-MS. You don’t need to operate either instrument to read a report well. You need to know what each one measures, and what it can’t.
Three questions a COA can answer
A report on a vial of peptide can answer up to three questions, and each needs its own measurement.
- Identity: is this the molecule the label names? Mass spectrometry is the usual answer.
- Purity: of the peptide material detected, how much is that molecule? HPLC answers this.
- Quantity: how many milligrams are in the vial? Quantitative HPLC against a reference standard answers this. Our guide to purity versus peptide content explains why it differs from purity.
How HPLC separates a sample
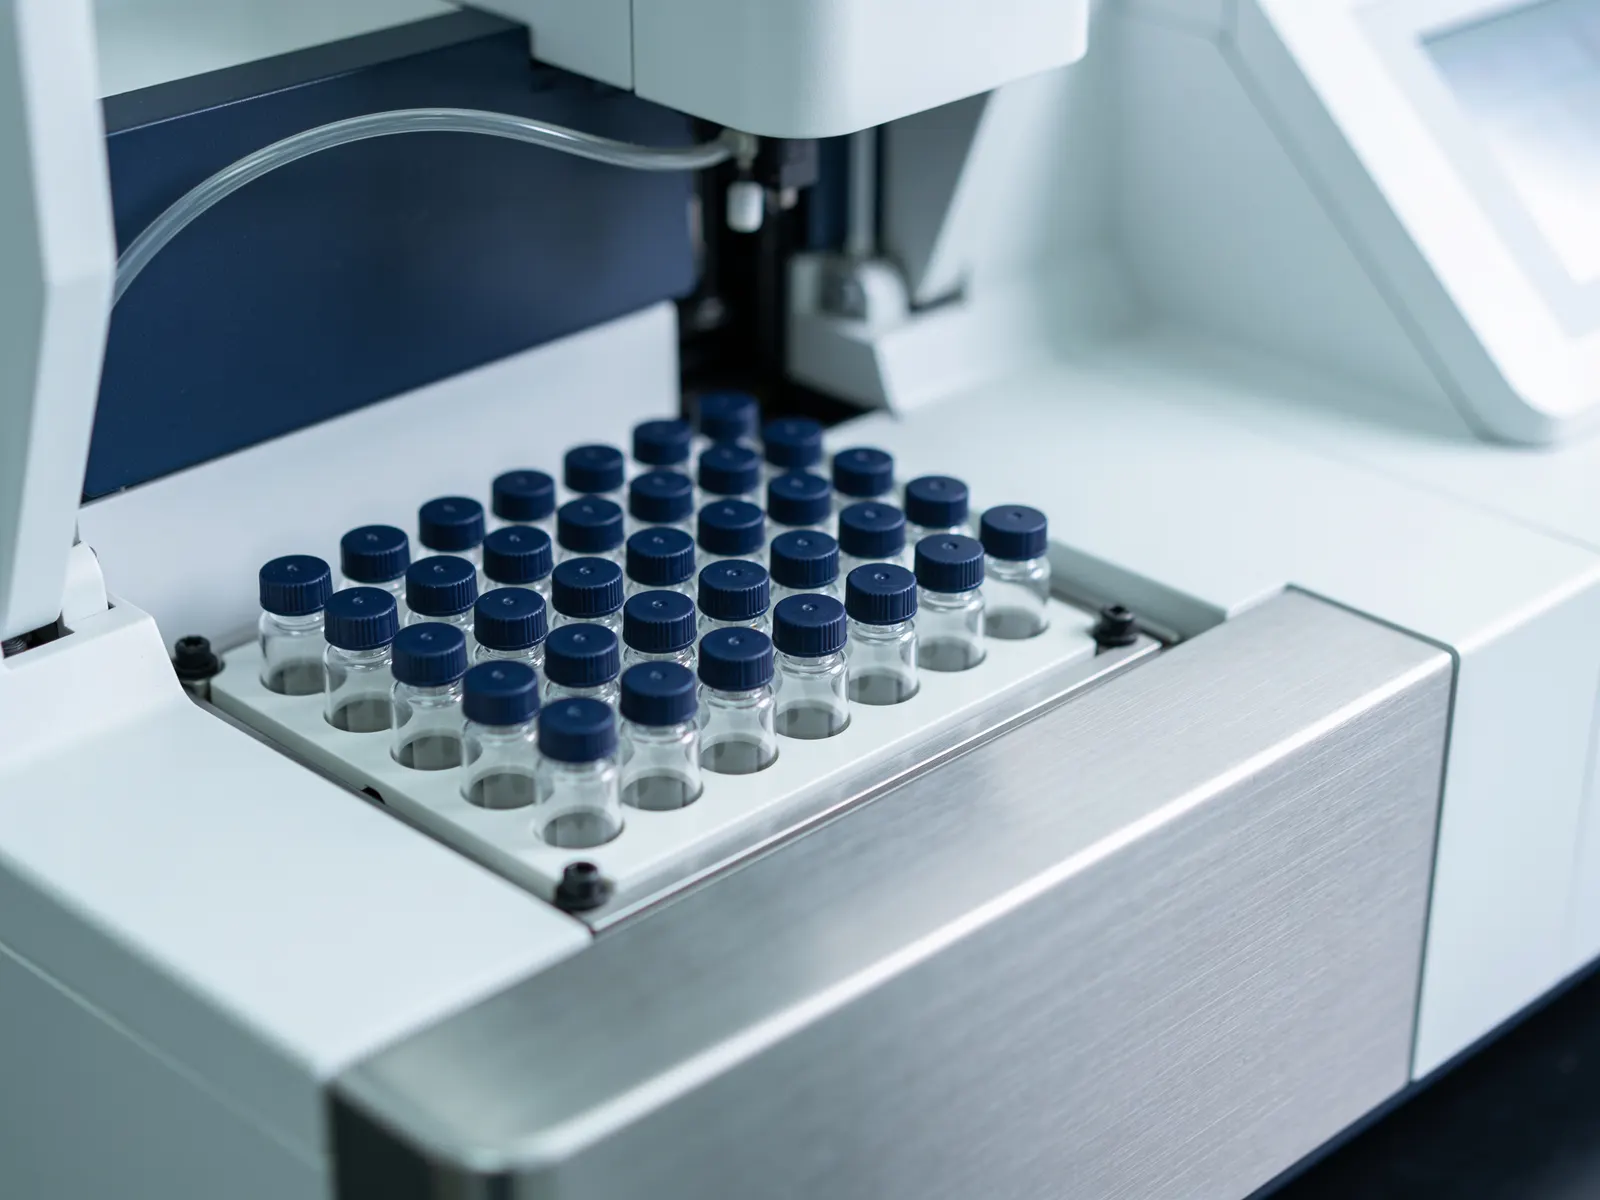
Peptides are almost always analysed by reverse-phase HPLC. The autosampler draws a few microlitres of the dissolved sample and loads it onto a narrow steel column packed with fine silica particles coated in long hydrocarbon chains. C18, an 18-carbon chain, is the most common coating.
A pump pushes liquid, the mobile phase, through the column at high pressure. It starts mostly as water and becomes steadily richer in an organic solvent, usually acetonitrile, with a little acid such as TFA or formic acid added. This rising gradient is what separates the sample. Molecules that are more hydrophobic cling to the coating for longer and leave later, so the sample comes out of the column spread across time, one substance after another.
At the outlet, a UV detector measures how much light passes through the liquid, usually at around 210 to 220 nm, where the peptide bond absorbs. The result is a chromatogram: absorbance plotted against time.
Reading a chromatogram
UV absorbance at 214 nm
Main peakRT 12.4 min
Related impurities
Solvent front
Retention time, minutes
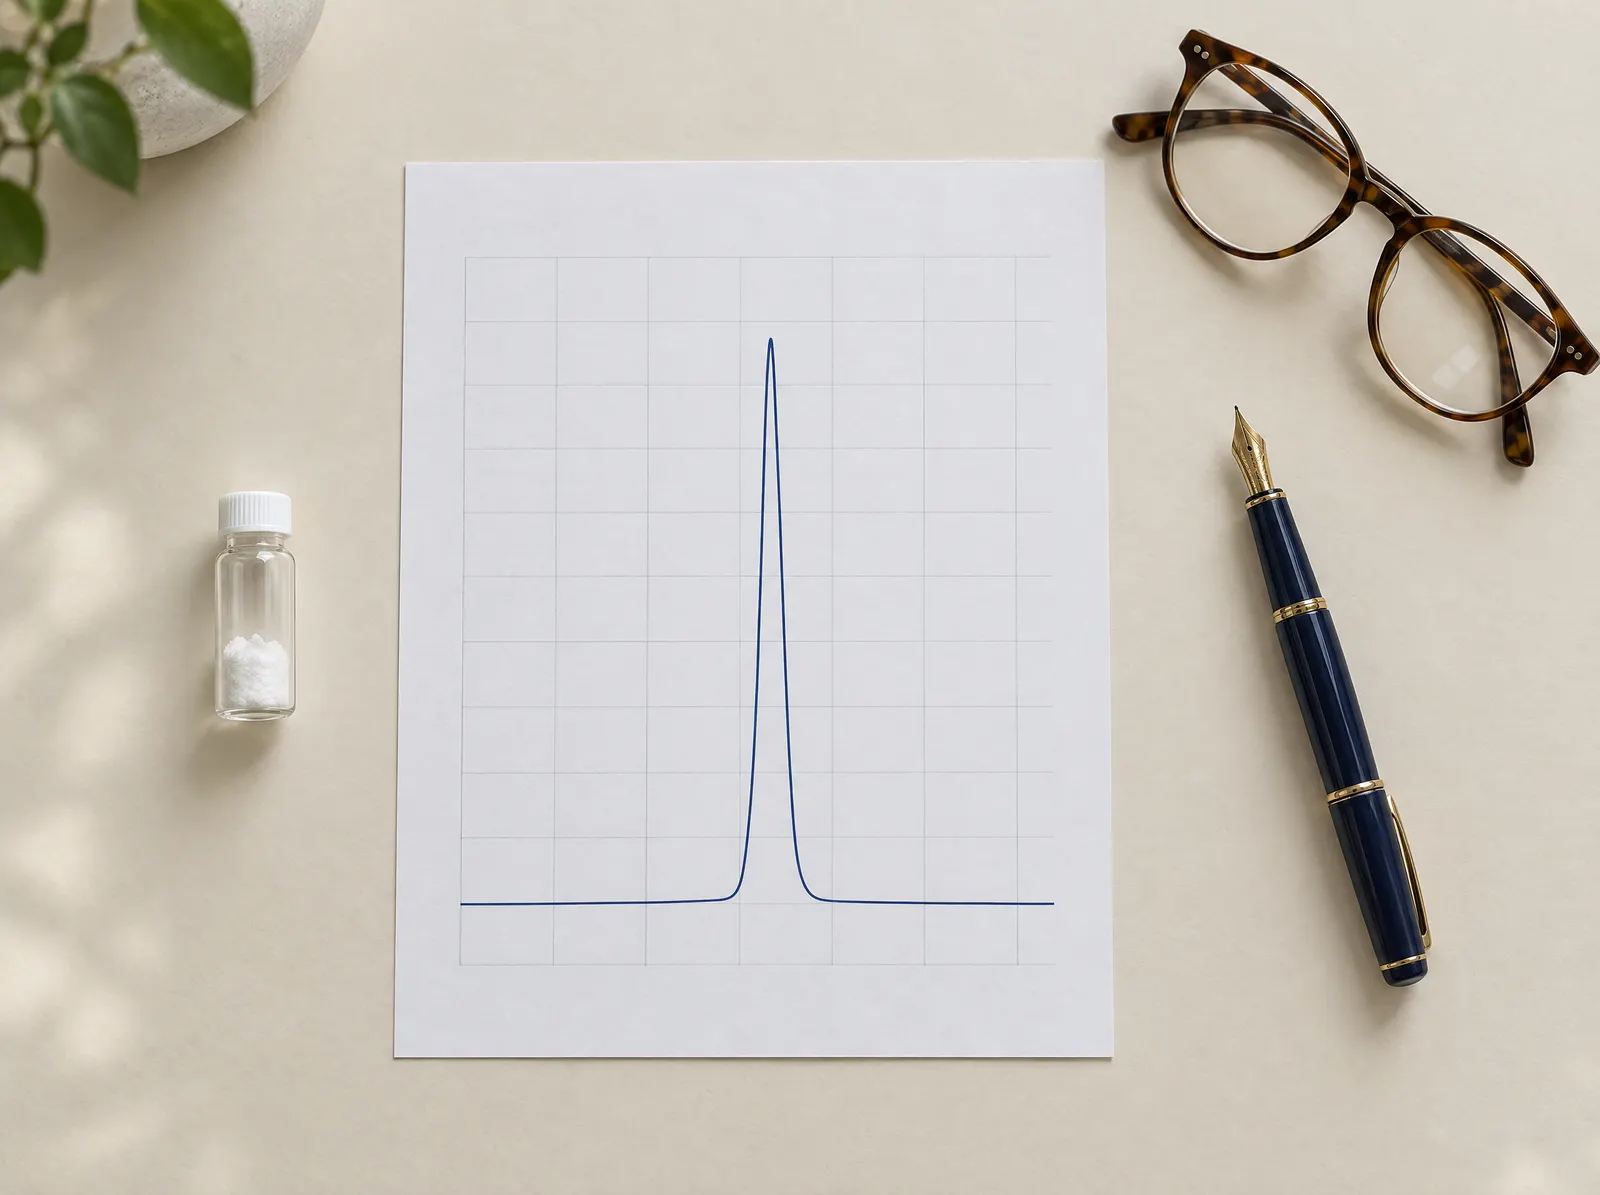
Each peak is one substance, or several that happened to come off together. Its position along the time axis is its retention time. Its area, not its height, is what tracks how much of it there is. The lab’s software decides where each peak begins and ends, a step called integration, and purity is the main peak’s area as a share of the total.
When you look at a chromatogram on a report, a few things are worth noticing:
- a flat, quiet baseline either side of the peaks;
- a main peak that is sharp and roughly symmetrical, rather than broad, split or trailing;
- small peaks near the main one, which are usually related sequences and are what the purity figure accounts for;
- a peak table, if one is printed, listing each peak’s retention time and area.
What mass spectrometry adds
A mass spectrometer measures the mass-to-charge ratio (m/z) of ions. For peptides, the usual way in is electrospray ionisation (ESI): the liquid is sprayed through a fine, charged needle, and as the droplets evaporate the peptide molecules pick up one or more protons. A peptide of mass M carrying n protons appears at m/z = (M + n × 1.007) / n.
Larger peptides pick up more charges, so a single molecule shows up as a family of peaks. Software combines them back into one mass, a step called deconvolution. If the measured mass matches the mass expected from the sequence, within the instrument’s tolerance, that is strong evidence the main peak is the right molecule.
| Compound | Mass (g/mol) | [M+H]+ | [M+2H]2+ | [M+3H]3+ | [M+4H]4+ |
|---|---|---|---|---|---|
| BPC-157 | 1,419.54 | 1,420.5 | 710.8 | 474.2 | 355.9 |
| Retatrutide | 4,731.35 | 4,732.4 | 2,366.7 | 1,578.1 | 1,183.8 |
Most entries in the compound library list a formula and molecular mass with the PubChem record they were checked against; where PubChem has no single record (blends, the copper complex, retatrutide) the entry says so. Where there is a figure, it gives you an expected mass to compare a report’s mass result with.
Identity and purity are separate results
A report can show 99% purity and still be of the wrong molecule, if nobody checked identity. HPLC will report a clean peak of anything that is clean. Equally, a correct mass says nothing about how much of the sample is that molecule. You need both results to know that the vial holds a clean sample of the right compound.
TB-500 shows why this matters. The name is used for two different materials: the seven-residue acetylated fragment of thymosin β4 (about 889 g/mol), and the full-length 43-residue protein, at roughly 4,960 g/mol. A purity figure alone can’t tell you which one is in the vial. A mass result can, at a glance.
What neither test can see
Both techniques are powerful, and both have blind spots. A standard COA doesn’t tell you about:
- Water and salts. They don’t absorb at the detection wavelength and aren’t counted in purity.
- Isomers with the same mass. Swapping an L-amino acid for its D-form, or two residues for each other, leaves the mass unchanged. Sequencing by tandem mass spectrometry (MS/MS), or comparison with a reference standard, is needed to tell them apart.
- Microbial contamination and endotoxin. These need separate tests entirely, such as an LAL assay for endotoxin. They matter for cell-based work, and a purity report says nothing about either.
- Other vials. The report describes the sample the lab received, not every vial in the batch.
Method details also shift results a little. Column, gradient, wavelength and integration settings can move purity by fractions of a percent, so small differences between two labs’ figures are rarely meaningful.
Questions to ask of any report
| Question | Look for |
|---|---|
| Which techniques were used? | HPLC for purity; MS or LC-MS for identity. HPLC alone leaves identity open. |
| At what wavelength? | Usually 210 to 220 nm for peptides. |
| Is there a mass result? | A measured mass that matches the expected mass for the sequence. |
| Is there a quantity? | Milligrams of peptide per vial, to compare with the label. |
| Can you check it at the lab? | A verify link or task number. See verifying a Janoshik COA. |
The test results page gathers published reports in one place, and our scoring method explains why a report you can check at the lab counts for more than one you can only read.
Research use only. Everything on Vialwise concerns research-grade material sold for laboratory and analytical use only. It is not a registered medicine, is not supplied for human or veterinary use, and nothing here is medical advice. Nothing in this guide is legal advice either; where regulation matters to your work, get advice for your own situation.