Reading lab reports
Purity versus peptide content: what a “99%” result does and doesn’t tell you
HPLC purity is a share of the chromatogram, not of the powder. How counter-ions and water fit in, and why a 99% vial can hold less peptide than its label.
- Published
- Reading time
- 7 min read
On this page7 sections
Key takeaways
- HPLC purity is the main peak’s share of the chromatogram, not the peptide’s share of the powder.
- Counter-ions such as TFA or acetate, residual water and any bulking agent add mass without lowering purity.
- A quantity result, in mg per vial, is the number to compare with the label.
- Blend reports list milligrams of each peptide per vial, because one purity figure can’t describe two peptides.
Most research peptide COAs lead with one number: purity, often 98% or 99% and above. It is a useful figure, but it answers a narrower question than many buyers assume. It tells you how clean the peptide is. It doesn’t tell you how much peptide is in the vial.
Two numbers, two different questions
A lab can answer two separate questions about a vial of lyophilised peptide.
- Purity: of the peptide material the lab can detect, how much is the target sequence?
- Content, or quantity: how many milligrams of the target peptide are actually in the vial?
They are measured differently and reported differently. A vial can do well on one and poorly on the other, and a report that gives only the first leaves the second open.
What HPLC purity measures
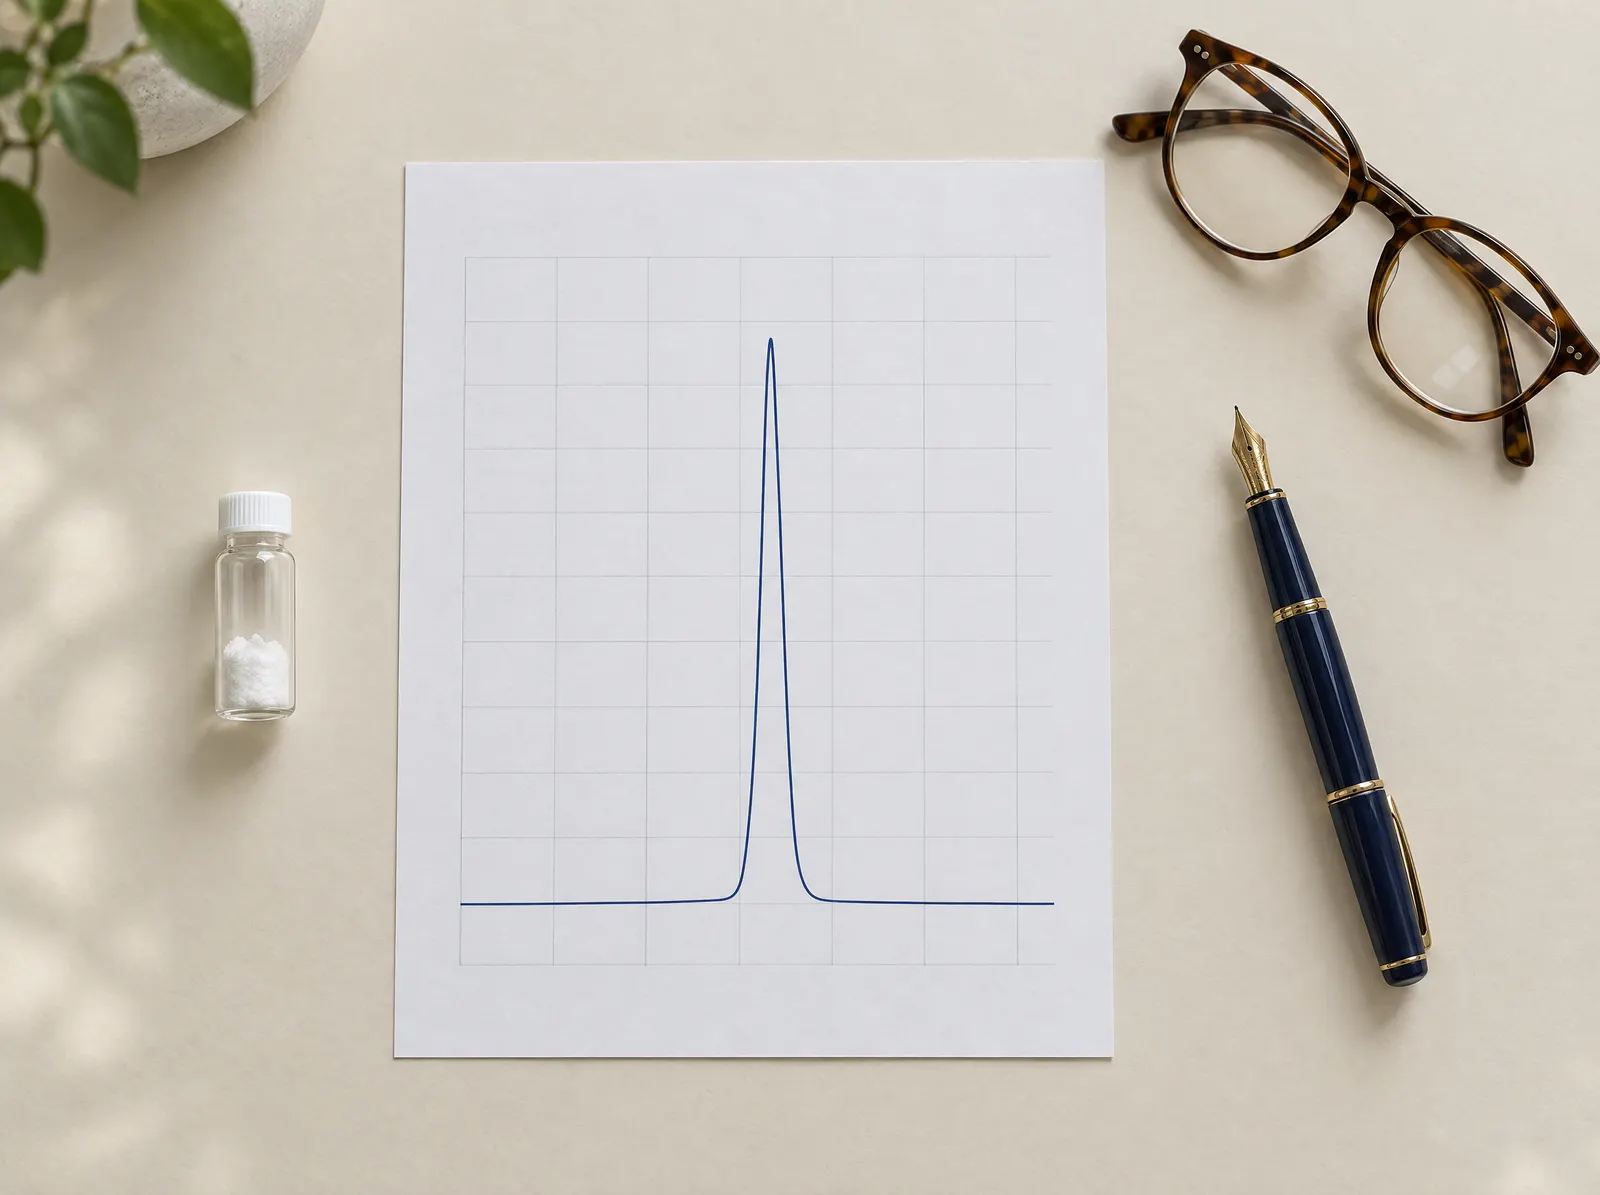
HPLC purity is almost always reported as area percent. The lab dissolves a small sample, runs it through a chromatography column that separates it into its components, and records the output with a UV detector, usually at a wavelength where the peptide bond absorbs, around 210 to 220 nm. Each substance that absorbs at that wavelength leaves a peak. Purity is the area of the main peak divided by the total area of all the peaks.
So “99.5%” means that 99.5% of the UV signal came from the main peak. In a synthetic peptide, most of the rest is related material: sequences missing a residue, chains that stopped short, leftover protecting groups, and oxidised or deamidated forms of the target. HPLC separates these well, which is why purity is the standard headline figure. Our guide to how HPLC and mass spec testing works covers the method in more detail.
Notice what the calculation leaves out. Anything that doesn’t absorb at the detection wavelength is invisible to it, and so is anything that comes off the column outside the part of the run the lab integrates. That includes most of what isn’t peptide.
What else is in the powder
A lyophilised peptide is rarely 100% peptide by mass, even when its purity is excellent. The powder usually also holds:
- Counter-ions. Basic groups in a peptide (lysine, arginine and histidine side chains, and the free N-terminus) carry a positive charge, balanced by negative ions picked up during purification. Most often that is trifluoroacetate (TFA), from the acid used in reverse-phase purification. Acetate and chloride are common alternatives when a peptide has been exchanged to another salt form. The more basic residues a sequence has, the more counter-ion mass it carries.
- Water. Freeze-dried powder is hygroscopic. It holds some residual moisture from manufacture and picks up more from the air whenever a cold vial is opened. See storing lyophilised peptides for how labs limit that.
- Excipients, in some products. Some preparations include a bulking agent, such as mannitol, to give the freeze-dried cake its structure. A supplier should say so if theirs does.
None of these is counted in an area-percent purity figure. They add mass to the vial without lowering the purity at all.
Net peptide content and quantity results
Net peptide content is the share of the powder’s mass that is actually peptide. It is measured by different methods from purity: amino acid analysis (breaking the peptide down and measuring its amino acids), elemental nitrogen analysis, or quantitative HPLC against a reference standard of known concentration. For lyophilised peptides it commonly sits somewhere between about 60% and 90%, depending on the sequence, the counter-ion and how dry the powder is.
Some labs, Janoshik among them, can also report a quantity: the milligrams of target peptide measured in the vial. That is the figure to compare with the label. A 10 mg vial with a quantity result of 10.2 mg holds what it says. One with 8.1 mg holds less, whatever its purity.
| Figure | Answers | Usually measured by |
|---|---|---|
| Purity (area %) | How clean is the peptide material? | HPLC with UV detection |
| Net peptide content (%) | How much of the powder is peptide? | Amino acid analysis, nitrogen analysis or quantitative HPLC |
| Quantity (mg per vial) | How much target peptide is in this vial? | Quantitative HPLC against a reference standard |
How a 99% vial can hold less than its label
Take a vial filled with 10 mg of powder. Suppose the peptide tests at 99% purity by HPLC, and the powder is 12% counter-ion and 6% water by mass. The target peptide in the vial is then 10 × 0.82 × 0.99, or about 8.1 mg. The COA would still say 99%.
What HPLC purity sees
Share of the UV signal from peptide material
- Target peptide 99%The main peak
- Related impurities 1%Deletion, truncated or modified sequences
What is in the vial
Share of the 10 mg of powder, by mass
- Target peptide 81.2%About 8.1 mg
- Related impurities 0.8%Still 1% of the peptide material
- Counter-ions 12%For example TFA or acetate
- Residual water 6%Held by the freeze-dried powder
Whether a label means 10 mg of powder or 10 mg of peptide is up to the supplier, and not every supplier says which. A quantity result settles the question for the vial that was tested. When you work out concentrations with the reconstitution calculator, the mass you enter should be the peptide mass you actually have, so it is worth knowing which one the label describes.
Why blend reports list mg per vial
A blend vial holds two or more peptides. A single purity figure for the whole vial would mix them together and hide the question that matters most: how much of each is there. So blend reports usually list the measured mass of each peptide per vial instead, and often print no purity figure at all.
A blend report reads as a list, one line per peptide, each with the milligrams the lab found in the vial.
Those per-peptide masses are what you would use to work out the concentration of each peptide in solution, rather than splitting the combined label amount. They are also why Vialwise never folds blend results into an average purity: a milligram figure and a percentage measure different things. The CJC-1295 and ipamorelin entry in the compound library shows the identity data for each component.
Reading the two numbers together
When a COA is in front of you, a few questions get the most out of it:
- What is the purity a percentage of? Area percent by HPLC, at a stated wavelength, is the standard.
- Is there a quantity or content figure, and how does it compare with the label?
- For a blend, is there one mass per peptide?
- Was identity confirmed separately, for example by mass spectrometry?
- Can you open the same report at the lab? Our Janoshik verification guide takes about five minutes.
The test results page keeps purity and content apart for exactly this reason. Every released report in it (11 of 18) opens at the lab, and pending ones are marked as pending.
Research use only. Everything on Vialwise concerns research-grade material sold for laboratory and analytical use only. It is not a registered medicine, is not supplied for human or veterinary use, and nothing here is medical advice. Nothing in this guide is legal advice either; where regulation matters to your work, get advice for your own situation.